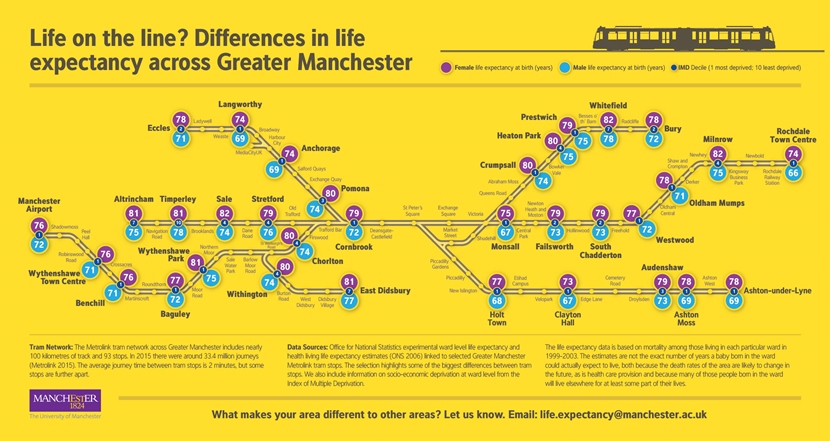
Researchers at The University of Manchester have mapped estimates of life expectancy and years lived healthily to the stops on the local tram network. Kingsley Purdam, who led the research, says the differences between areas in the UK are a human rights issue.
Devolution and living longer
Greater Manchester is home to a population of 2.7 million people, across ten local authorities. In 2016, it became the first English region to be handed control of its health and social care budget from central government. £6bn in public funding has been devolved to a local governance body made up of the ten local councils, the National Health Service and health groups. This so-called ‘Devo Manc’ initiative is focused on integrating care tailored to local needs under the banner of Living Longer, Living Better.
The initiative faces some big challenges, including differences in how long people live. Looking back over the last two centuries we can see the substantial increases in life expectancies in England and Wales. In 1851 life expectancy in England and Wales was estimated to be only 41 years and just 30 years in Manchester. Today life expectancy is estimated to be 81.5 years in the UK (79.5 years for men and 83.2 years for women). However, despite the overall increase in life expectancy, the gap between economically deprived and prosperous areas is increasing (Buchan 2011, ONS 2015).
Life expectancy – and healthy life expectancy – in some parts of Greater Manchester are amongst the lowest in the UK. According to the Office of National Statistics (ONS), the city of Manchester area is in the top ten of those in the UK with the lowest life expectancy, with people having an estimated lifespan at birth of 74.8 years. Manchester has the lowest life expectancy of any local authority area in the UK for women. Men and women aged 65 years in Manchester have the lowest life expectancy compared to other areas of the UK – men 15.9 years; women 18.8 years. This compares to 21.6 years for men in Kensington and Chelsea and 24.6 years for women in Camden. Healthy life expectancy (years of life in good health) can be as low as 54.4 years old for women in Manchester, compared to 72.2 years in Richmond upon Thames.
Tram-stop illustration
In order to highlight these striking differences, we linked ONS ward level estimates of life expectancy to the tram stops on the Greater Manchester tram network. We also included information on socio-economic deprivation levels using the Index of Deprivation.
The journey from Timperley to Rochdale (one of the most economically deprived areas of Greater Manchester, where life expectancy is 69.4 years) can take around 75 minutes for a journey of 26 kilometres, but the difference in life expectancy between the areas is more than a decade – around a year for every 7 minutes.
Mind the gap
The life expectancy gap between men and women is striking at the local level. For example, in Timperley life expectancy for men is estimated to be 78.3 years compared to 81.3 years for women – a difference of 3 years. However in Rochdale life expectancy for men is estimated to be 65.7 years compared to 74.3 years for women – a difference of 8.6 years.
The ONS estimates are based on mortality rates among those living in a particular ward from 1999-2003. It is not the number of years a baby born in the ward could actually expect to live, because the death rates and health care provision in an area are likely to change in the future, and many of those born in the ward will live elsewhere for some part of their lives.
Healthy life expectancy also varies considerably across local areas. In Timperley health life expectancy is 73.7 years, compared to 58.3 years in central Manchester (Monsall) and 58.1 years in Rochdale. The gap for men is higher, at nearly 18 years compared to 13 years for women. This healthy living gap impacts on the people themselves, as well as the families and friends around them.
The socio-economic gradient in the differences in life expectancy and years living healthily across Greater Manchester and the UK as a whole are striking. A range of often interrelated factors are associated with lower life expectancy such as low income, employment status, the local environment, housing, access to health care, smoking and alcohol consumption levels, diet, exercise, social status and social isolation. The most common causes of death in the UK are from circulatory diseases (including heart disease and strokes), cancer, respiratory diseases, dementia and Alzheimer’s disease (ONS 2015).
A human rights issue
The devolution of funding has brought the area’s health inequalities into renewed focus. Of course, not all areas of Greater Manchester are covered by the tram network, but the tram stops do provide a quick and easy way to communicate the evidence, raise awareness and encourage debate about people’s health in Greater Manchester. The differences in life expectancy between areas within our cities and right across the UK are in my view a human rights issue and I am not alone in thinking this The lost years of life and healthy living have an impact not just on the individual but also those who care for them and who are ultimately left behind.
We all need to look after our health but many of us, including the most vulnerable populations, need help at a time when evidence suggests that services for older people are being cut. Tackling the long-term inequalities in life expectancy and years of healthy living needs to be fundamental to the new approach to delivering health and social care across Greater Manchester.
- This blog post is part of ongoing research at the University of Manchester. For more information contact life.expectancy@manchester.ac.uk
- For life expectancies across the London Tube network see Dorling 2013 and Cheshire and O’Brien 2012.

