How ethnic minorities fare compared to the White British varies according to where they live, writes Dr Nissa Finney. She argues that addressing ethnic inequalities is an important local concern.
In Manchester, a quarter of ethnic minorities live in overcrowded housing compared to around one in ten of the White British population. The unemployment rate for ethnic minorities is 5% higher than for the White British. These inequalities in the city worsened over the 2000s.
But the issue of ethnic inequalities is not one only for diverse cities such as Manchester. A report launched today – produced by CoDE in collaboration with the Runnymede Trust – demonstrates that ethnic inequalities exist not only in diverse and deprived areas, but also in areas with low ethnic minority concentrations, in more affluent areas and rural areas.
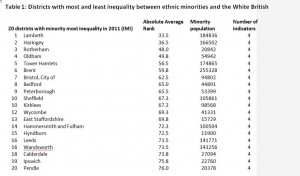
 The 20 districts with the largest ethnic inequalities (Table 1, below) include diverse urban areas – such as Lambeth, Haringey, Oldham, Tower Hamlets, Sheffield and Leeds – but also less urban areas with smaller ethnic minority populations, including East Staffordshire, Hyndburn and Pendle.
Map 1, which gives a ranking of districts’ ethnic inequality score, also shows that some of the districts with the largest ethnic inequalities are in areas of the country that are not usually noted for issues relating to their diverse populations, including parts of Kent, Somerset and Lincolnshire.
The need for authorities throughout the country to consider ethnic inequalities is further highlighted if we consider particular ethnic groups. For example, the White Other group is experiencing disadvantage in employment, education, health and housing in relation to the White British group. This is most notable in districts outside the major urban centres, as shown in Map 2.
Ethnic inequalities are not only widespread in England and Wales, they have remained persistent since 2000. These inequalities are not, and will not, disappear of their own accord.
This is particularly the case for ethnic inequalities in employment and housing, which have worsened in a large proportion of districts between 2001 and 2011. For example, over this decade ethnic housing inequality (as indicated by levels of overcrowding) was experienced in every district in England and Wales in 2011 (as it was in 2001). In the majority of districts the level of inequality worsened over the 2000s, particularly outside urban centres, as Map 3 shows.
Indeed, many of the districts that became more unequal between 2001 and 2011 are semi-rural and rural districts that at the start of the decade had low ethnic diversity levels and small ethnic minority populations.
The picture, however, is not entirely negative. There are some welcome exceptions to the overall trend. Some districts are success stories for having reduced ethnic inequalities over the 2000s. One such district is Bradford, which is often maligned on race relations.
Bradford – where 36% of the population identify with an ethnic group other than White British – has dropped out of the 20 districts with the greatest ethnic inequality. One driver of this has been improvement in educational attainment for all ethnic groups.
In 2001 the proportion of 16-24 year olds with no qualifications from ethnic minority groups in Bradford was higher than for the White British (25% compared with 19%); by 2011, the minority population in Bradford had similar levels of education as the White British group (14% of 16-24 year olds from each group had no qualifications).
Of course, every area’s experience is complex. Although Bradford has reduced ethnic inequalities for minorities overall compared to other districts, high levels of ethnic inequality exist, particularly in employment and housing.
The findings from this project raise many questions about why ethnic inequalities exist in some places to a greater extent than others and what might be done about them. The findings provide clear evidence that ethnic inequalities are a local concern and that addressing inequalities is not purely an issue for authorities with diverse and poor populations. They also demonstrate that inequalities can be reduced and that some districts across the country achieved this during the 2000s.
This blog is based on a major new report launched today, 3 December 2014 in London. The event is organised by the New Local Government Network in association with the Centre of Dynamics in Ethnicity (CoDE) and the Runnymede Trust, and will be addressed by Stephen Williams MP, Minister for Integration and Race Inequality.
The views presented here are those of the author, and do not necessarily reflect those of other members of the Centre on Dynamics of Ethnicity (CoDE).
Note on the project and its resources:
In collaboration with the Runnymede Trust, CoDE has produced measures of ethnic inequalities in education, employment, health and housing for each local authority district of England and Wales for 2001 and 2011, using census data.
Inequality is the difference in the proportion of the White British group and the ethnic minority group who experience disadvantage on a particular indicator. The indicators of inequality used are: percentage aged 16-24 with no qualifications (education); percentage aged 25 and over who are unemployed (employment); percentage with a limiting long term illness (indirectly age standardized) (health); percentage living with an occupancy rating of -1 or below, indicating overcrowding (housing).
Resources available from the project are as follows:
– Local Ethnic Inequalities Area Profiler. This Excel-based tool allows you to explore summary data for each district
– Report, summarising key findings and detailing methods of the project.
– Briefing, highlighting key results and their policy implications.
