The political debate about public spending in the UK is bedevilled by myths and spin about how much we actually spend. So I thought it was time for a little myth-busting primer, with some pretty diagrams, about how we should be discussing public spending….
There are three main ways of measuring public spending, each of which has advantages and disadvantages.
Nominal (Cash) Spending
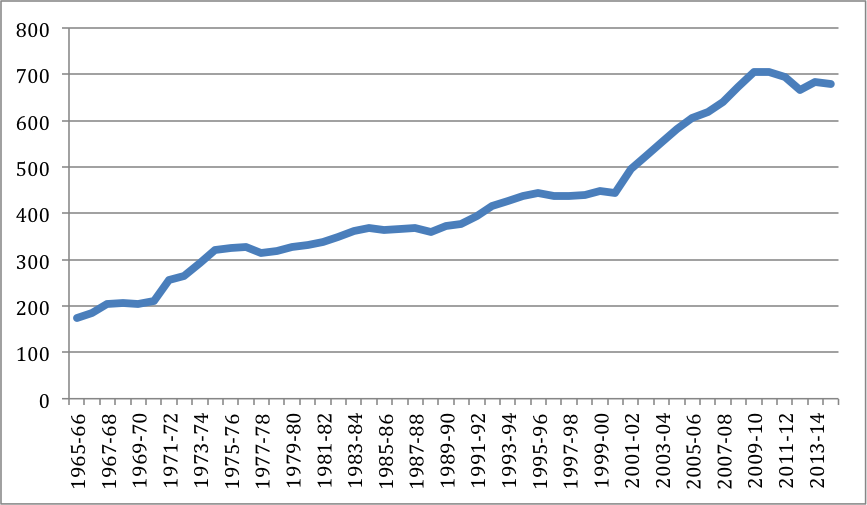
The first is in what is technically called the “nominal” amount spent – that is in actual cash that goes out of the Treasury coffers. Because of the effects of inflation, this nearly always rises (see Figure 1). Only twice in the past half century has the cash amount fallen – in 2000-01. It is forecast to fall again, for one year only, in 2012-13.
This is useful to some who want to argue that the State spends too much – for example some right-wing Conservative politicians and think-tanks currently claim that we are not experiencing “cuts” because the actual amount of cash being spent by the government continues to rise. Figure 1 makes it look like the State is an ever-increasing devourer of resources. But if inflation in prices is taken into account, things look a bit different.
Figure 1 Public Spending in ‘nominal (cash) terms 1965-66 to 20214-15 (£ billion)

Source: based on HM Treasury[i]
Real-Terms Spending
Real-terms spending is the amount spent with inflation taken into account.
Figure 2 Public Spending in Real-Terms (2011-12 prices)(£ billion)
Real-terms spending shows a far less dramatic increase than nominal spending, and some periods where spending levelled-off or even decreased. It shows, for example, a significant (mainly forecast) decrease in real-terms under the current Coalition government.
Again though, this way of looking at public spending can make it look like the State is a more-or-less ever expanding beast soaking up more and more of the nation’s wealth. This may, or may not be true – but the only real way of knowing is by seeing how public spending compares to nations wealth.
Spending as a proportion of GDP
Gross Domestic Product (GDP) is the main measure used by governments and others to estimate how wealthy countries are. There are many criticisms of GDP measurement, which we won’t go into here, but it’s the best we have at the moment for tracking growth (or lack of it) in our won economy and comparing our economic performance with other countries.
Public spending as a proportion of GDP has thus become the main, and most useful, way of tracking how much our national wealth we devote to public activities as opposed to private enterprise.
It’s main fault is obvious: because it is a ration of public spending and GDP a sudden change in GDP can easily look like a sudden change in public spending. Thus, for example, it looks like public spending suddenly sky-rocketed in the last three years of the last Labour government (see Figure 3) – whereas in fact (in real-terms – see Figure 2) it only increased slightly. The sudden change from 40.7% of GDP to 47.3% was almost entirely due to the recession the UK experienced as a result of the Global Financial Crisis (GFC).
Figure 3 Public Spending as a percentage of GDP (1965-66 to 2014-15)
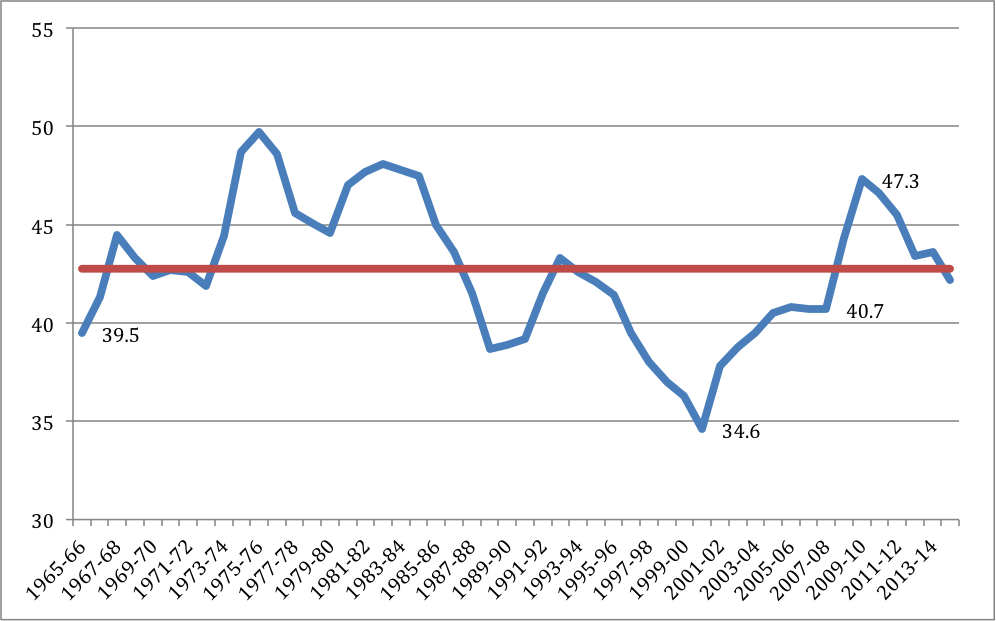
Public spending as a proportion of GDP has averaged just under 43% of GDP (42.76% to be more precise) for the past 50 years.
It has swung between as high as 50% (under Labour 1975-76) and as low as 35% (also under Labour in 2000-01).
But what a detailed analysis of these figures shows is that some of mythology that passes for political “facts” in Britain is just that – myth.
The first is that Labour is always the “tax and spend” Party whereas the Conservatives are far more thrifty with the public’s money.
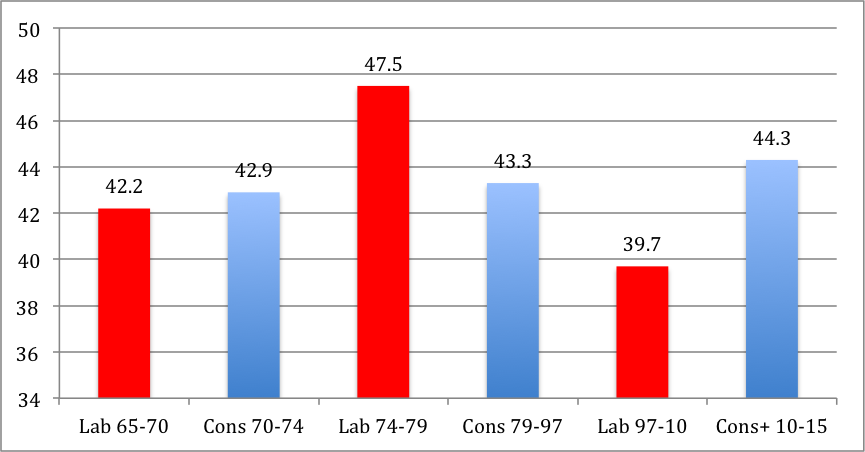
The facts are rather more mixed (see Figure 4). It is true that the 74-79 Labour Government spent on average more, as a proportion of GDP, than any other government in the past 50 years – but this is not true for the other periods of Labour government, when Labour spent less, on average, than the Conservative (or Conservative led) governments.
In particular the widespread myth that the last “New” Labour government spent vastly more is just that – a myth. On average, even including the effects of the GFC, the last Labour government spent the least of the Governments since 1965. The myth has grown up because both Labour and their opponents wanted to promote the idea Labour spent lots. And because, especially between 2000 and 2005, Labour did rapidly increase spending – especially on health and education – but only after a period of unprecedented low spending between 1997 and 2000.
Figure 4 Public spending as percentage of GDP under different Governments (1965-2015)
This analysis only covers one aspect of public finances – spending – which is itself only one measure of how big the State is. But I hope it will help people to explain, and explore, some of the real issues about public spending rather than trading in myths and spin.
[i] All the figures used in this analysis are based on Public Expenditure Statistical Analysis (PESA), published annually by HM Treasury. The figures for 1971-72 to 2014-15 are taken from PESA 2012. For 1965-66 to 1970-71 are taken from PESA 2003. Some of the calculations are my own, based on the HMT figures.
[…] http://whitehallwatch.org/2013/01/14/measuring-leviathan-big-government-and-the-myths-of-public-spen… […]