Will urban growth policy benefit all or will it leave some parts of the community no better off? Richard Crisp explains how a new measurement tool – the inclusive growth monitor – can shed light on this issue.
Like any occasional visitor to Manchester I am always struck by the sense of a city on the move. New buildings emerge seemingly overnight whilst the city displays a restless energy as shops, bars and restaurants appear and then, just as often, dissolve to be replaced by something even more brash and contemporary.
Yet I know that if I head eastwards from the city centre past the warehouse conversions in Ancoats then a very different Manchester comes into view. East Manchester has some of the highest levels of poverty and worklessness in England. It’s where I cut my teeth as a junior researcher crunching statistics as part of the New Deal for Communities programme.
This divided geography is, of course, a feature of many of England’s towns and cities. But the persistence of disadvantage alongside visible development raises important questions about how the proceeds of growth are shared. This vexing issue of ‘inclusive growth’ is one that is increasingly being taken up by policymakers in the UK as Ruth Lupton explained in her earlier blog post on this site.
Mind the gap
The starting point for that conversation is, surely, to understand the degree to which existing growth is inclusive. To this end, the Joseph Rowntree Foundation commissioned researchers at Sheffield Hallam University to develop an inclusive growth monitor. The brief was simple: come up with a way of measuring the relationship between poverty and growth in the UK.
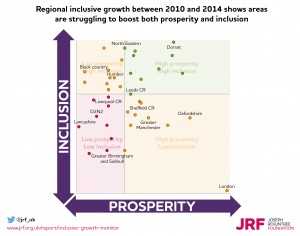
So we produced an inclusive growth monitor that uses 18 indicators to explore that relationship. Full details can be found in a report launched today. Nine indicators capture the extent to which areas achieve ‘inclusion’ as measured by positive outcomes around poverty-related factors such as worklessness and low earnings. The remaining nine indicators measure economic ‘prosperity’ in terms of things such as business creation and workforce skills. Data is presented for all 39 Local Enterprise Partnership (LEP) areas (typically city regions made up of several local authorities). The inclusive growth monitor converts the relative performance of each LEP against each indicator into overall scores for ‘inclusion’ and ‘prosperity’.
North-South divide?
The results for 2014 – the latest year for which data are available – are perhaps not surprising as they reprise a familiar North-South divide. LEP areas with higher levels of prosperity tend to have higher levels of inclusion, and vice versa. And those with the highest levels of prosperity and inclusion tend to be in the South and East of England; the lowest levels are largely found in the North and Midlands.
But when you look at change over the four year period from 2010 to 2014 covered by the inclusive growth monitor, it becomes clear that prosperity and growth do not always move in lockstep. This is apparent in some LEP areas that had lower levels of inclusion to start with. London stands out for experiencing the highest positive amount of change in prosperity and the lowest positive amount of change in inclusion relative to other LEPs. In other words, very high levels of growth are not associated with significant inroads into high levels of disadvantage.
At the other end of the scale, some LEP areas with less buoyant economies such as Black Country and Greater Lincolnshire have seen less change in prosperity but more positive change in inclusion compared with other LEPs. This indicates that areas with weaker economies (as measured by prosperity indicators) still have some capacity to reduce disadvantage such as workless households or fuel poverty (as measured by inclusion indicators).
Prosperity is not enough
These findings have two implications for the inclusive growth agenda. First, in some areas, prosperity is not enough and there is a need for strategies and interventions to ensure the benefits are more widely spread. That’s clearly the case in London. Second, positive outcomes around inclusion can still be achieved with only limited improvements in prosperity in areas with less buoyant economies. This suggests the current ‘pro-growth’ focus of urban policy in England, which tends to favour areas best primed for development, may be missing a trick. At the very least, we need to understand why some areas make valuable inroads into disadvantage without significant growth, and whether further investment might accelerate those improvements.
This picture of change will become sharper over time as the inclusive growth monitor is updated annually by the Inclusive Growth Analysis Unit at the University of Manchester Local authority level data will also be made available for Greater Manchester and the Leeds City Region.
As it stands, the inclusive growth monitor is the start of a conversation we hope will draw in LEPs, combined authorities and other stakeholders. It’s a timely conversation as the devolution juggernaut in England opens up new possibilities for harnessing growth to wider social objectives.

