Inequality can be sliced many ways. A key aspect of the UK’s picture on inequality falls starkly along spatial lines of geography. So how can mapping spatial differences make policymaking more effective and targeted? In this article, from our Power in Place publication, Professor Cecilia Wong and Dr Wei Zheng discuss the importance of spatial mapping and how it can inform place-based policymaking.
- Robust spatial analysis provides a more grounded understanding of issues, permits benchmarking by contrasting and comparing places and lays bare different socio-economic conditions.
- Spatial analysis illustrates the complex trajectories of local economic performance and can inform place-specific policymaking to improve economic performance.
- Spatial analysis highlights different local challenges and offers opportunities for more creative spatial thinking to exploit synergies and partnership working across different places.
Place-based approaches
It is encouraging that the government has recently committed to place-based policymaking to tackle entrenched spatial inequality. However, there has been a lack of spatial analysis to pinpoint the different challenges encountered in local areas. This is essential to inform the policy debate. There is a need to develop robust spatial analysis by bundling key indicators. This will provide a more grounded understanding of issues and permit benchmarking by contrasting and comparing places.
In addition, visualisation of the different spatial patterns through mapping analysis can lay bare different socio-economic conditions, as well as showing the neighbouring context between different places.
Illustrating spatial inequality by numbers
This can be illustrated by taking labour productivity and employment change as an example. There has been intensive debate over the so-called ‘productivity puzzle’, relating to the UK’s significantly lower level of productivity growth after its sharp fall during the 2008 global financial crisis. This puzzle is made all the more intriguing when considering the growth in employment over the same period.
Persistent spatial divide of labour productivity
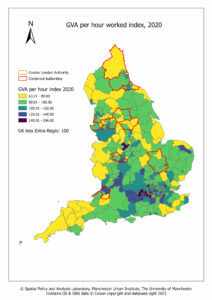
The most recent small area labour productivity data (2020), shown in Map 1, confirms the persistent spatial divide between London and the Southeast regions and the rest of the country in terms of gross value added (GVA) per hour worked. There is also a north-south divide among the combined authority (CA) areas, with the West of England and Cambridgeshire and Peterborough CA area out-performing the others. Map 1 also highlights the fact that there were major spatial variations in productivity levels across different local authority districts (LADs), even within the CA areas.

In numerical terms, we can see this inequality more starkly. In 2020, GVA per hour rate in Greater London was £47.25, followed by West of England’s £34.71 and Cambridgeshire and Peterborough’s £32.31.
Recent trends in labour productivity
Between 2015 and 2019, five CA areas outside southern England enjoyed growth in GVA per hour worked by over 4.4% in real terms. They were West Yorkshire, North of Tyne, Greater Manchester, the North East, and West Midlands – outperforming Greater London’s 3.19% increase. Due to this upward trajectory, Greater Manchester’s labour productivity has been catching up and reached a level of £33.22 value added per hour worked in 2019 – the highest productivity outside of southern England.
However, the impact of the COVID-19 pandemic on labour productivity has been detrimental to all areas, ranging from -4.79% in Greater London to -6.93% in South Yorkshire between 2019 and 2020.
The situation was particularly challenging in South Yorkshire, Liverpool City Region and Cambridgeshire and Peterborough CA areas as their GVA per hour worked in 2020 was even lower, in real terms, than in 2004.
Trends and underlying factors of employment growth
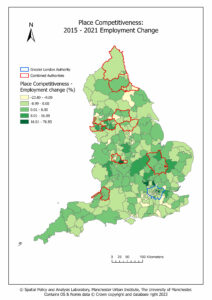
Alongside GVA, we can look at employment growth patterns. These have been mixed across CA areas, ranging from 0.24% in Tees valley to 12.94% in Greater Manchester between 2015 and 2021. While the southern CA areas in West of England (12%) and Cambridgeshire and Peterborough (9.09%) exhibited high growth, there has been an emergence of a high performing Mersey Belt across Greater Manchester (12.94%) and Liverpool City Region (11.04%) CA areas.
By drilling down into the components of employment change, the analysis shows that variations in employment growth during 2015-2021 were mainly related to differential place competitiveness conditions (total regional growth minus the national growth and industrial mix effects). This accounted for 98.2% of local variations whereas local industrial mixes (regional growth explained by that industry’s growth at the national level) accounted for 1.3%. The relatively high levels of employment growth witnessed in Greater Manchester and Liverpool City Region were largely attributed to their increase in place competitiveness advantages across most of their local authorities (see Map 2). The West of England CA area, however, enjoyed growth from both its favourable industrial mix and its increased place competitiveness.
Since local competitiveness condition is the residual value after taking account of the national economic situation and the industrial mix, working out what constitutes these conditions in individual areas requires in-depth local knowledge.

Differential spatial trajectories require different policy action
The analysis here illustrates the complex trajectories of local economic performance when examining different economic indicators. While some areas score well on employment growth, their GVA level remains low with stagnant growth in both GVA and employment (for example, South Yorkshire). Others are doing well on GVA level but becoming less competitive in their place conditions (such as some London boroughs). This data can inform place-specific policymaking to improve economic performance in these areas.
While the analysis largely confirms the paradoxical relationship between productivity and employment growth, it does highlight some key messages. GVA per hour worked is associated with the concentration of specific types of high-paid industrial sectors such as the information and communication sector; the professional, scientific and technical sector; aerospace; and car industries. Different places do perform differently on these indicators and as a result they will require different policy action. Emerging spatial clusters of areas sharing similar characteristics could be identified through spatial mapping analysis to foster synergy in collaborative strategy.
We can build on this data to create even more detailed pictures of different areas. For example, over a quarter of the population was found to be economically inactive in some LADs across the Greater Manchester CA area including Manchester, Bolton, Oldham and Salford. Economic inactivity is also found to be closely associated with unemployment levels and lower life expectancy. These all have implications on labour productivity and economic performance of places and should be factored into place-based policymaking.
Good policy on place-making needs to have strategic vision. This type of spatial analysis highlights different local challenges and offers opportunities for more creative spatial thinking to exploit synergies and partnership working across different places, both within and beyond local and combined authority boundaries.
This article was originally published in Power in Place, a collection of thought leadership pieces and expert analysis providing evidence-led solutions for thriving and sustainable communities.
Policy@Manchester aims to impact lives globally, nationally and locally through infleuncing and challenging policymakers with robust research-informed evidence and ideas. Visit our website to find out more and sign up to our newsletter to keep up to date with our latest news.
