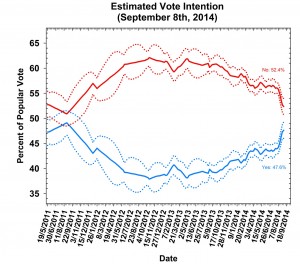
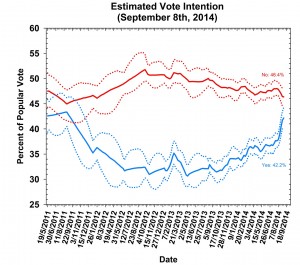
This is a Scottish independence special of a regular series of posts that reports on the state of support for the parties in Westminster as measured by opinion polls. By pooling together all the available polling evidence the impact of the random variation each individual survey inevitably produces can be reduced. Most of the short term advances and setbacks in the polls are nothing more than random noise; the underlying trends – in which the authors are interested and which best assess the state of public opinion – are relatively stable and little influenced by day-to-day events. Further details of the method used to build these estimates of public opinion can be found here.
In recent weeks the debate over Scottish independence has reached fever-pitch, and debate over some of the polls has been just as fierce. Most notably a YouGov poll for the Sunday Times, published on 7 September, caused shock waves both North of the border and in Westminster when it showed ‘Yes’ marginally ahead – the first lead for the Yes campaign in many months.
As regular readers of the Polling Observatory will know, we tend to take a conservative view of sudden movements in public opinion. Most short-term shifts in the polls are nothing more than random noise. Indeed, a recent study shows that apparent swings in public opinion during campaigns are often not due to actual shifts in opinion, but instead result from differential response rates: in other words, supporters of the side currently faring worse in the polls are less likely to respond when surveyed.
The method we apply to Westminster polling can also be used to look at the underlying balance of opinion in Scotland. We estimate current referendum sentiment by pooling all the currently available polling data, while taking into account the estimated biases of the individual pollsters (“house effects”).
Because we have no fixed reference point for “true” public opinion (i.e. the accuracy of all the pollsters will only become known on the day of the vote), we make adjustments relative to the “average pollster”. This assumes that the polling industry as a whole will not be biased. This assumption could prove wrong, of course, but we have no way of knowing what any biases might be. We can only draw on the historical record – and referendums are both very rare and very unusual political events, so this record must be interpreted with caution. That important caveat noted, it is worth highlighting that past evidence suggests an underestimation of No support is somewhat more likely.
 Our data cover the period up to 6 September, including the YouGov poll that put the Yes camp in the lead for the first time (and so does not include subsequent polls by Survation and YouGov that have the No camp back in the lead).
Support for the Yes camp has surged in the last six weeks or so, leading some forecasts to put the chances at close to even, but the independence campaign still lagged in our estimates even after the YouGov poll. Subsequent polls, including one on 11 September by YouGov, have all shown No narrowly ahead, suggesting the 48%-52% margin we find here has not altered in the last few days. While the race has got considerably closer, the polling evidence still makes No the favourite.
The same pattern is repeated if we look at the trend for unadjusted responses below (undecided voters are not plotted on our graph), although here support for the Yes and No camps is even closer. There is some suggestion here that Yes has surged by winning over “don’t knows” rather than converting No supporters; Yes has risen by a good deal more than No has dropped. However, the current balance of opinion suggests that Yes will either have to win a large majority of the remaining undecided or convert some No votes to its camp in the final few days.
As mentioned above, our method also makes it possible to estimate the “house effect” for the survey responses for each polling company, relative to the Yes and No figures we would expect from the average pollster. That is, it tells us simply whether the reported share of responses for Yes, No and Don’t Knows is above or below the industry average. This does not indicate “accuracy”, since there is no final vote against which to benchmark the accuracy of the polls. It could be, in fact, that pollsters at one end of the extreme or the other are giving a more accurate picture of voters’ intentions – but the final vote is the only real test, and even that is imperfect. In the table below, we report all companies’ support for the Yes and No camps (and for don’t knows) relative to the median pollster.
Table: House effects of independence pollsters relative to median pollster
| House | Mode | Yes | No | DK |
| YouGov | Internet | -0.5 | 4.6 | -4.2 |
| ICM | Internet | 0.5 | -2.1 | 1.5 |
| Panelbase | Internet | 4.4 | -2.3 | -1.9 |
| Ipsos-MORI | Telephone | -0.6 | 6.5 | -5.9 |
| TNS-BRMB | Face-to-face | -5.6 | -4.2 | 9.8 |
| Survation | Internet | 1.5 | -0.1 | -1.0 |
Our estimates show substantial differences across polling houses. While YouGov (+4.6) and Ipsos-MORI (+6.5) tend to report higher responses for the No camp, Panelbase (+4.4) and Survation (+1.5) tend to show higher numbers for the Yes camp. Interestingly, TNS-BRMB, which is the only polling company to carry out face-to-face surveys about the referendum, report lower responses for both the Yes and No camps, and a much higher proportion of undecided voters.
With less than a week now until Scotland goes to the polls, and with the campaign raging on as big hitters on both sides of the border fight it out, there is still time for late movements in public opinion. A lot will also depend on the turnout – voter registration for the referendum is exceptionally high at over 97% – well above the 85% registration rates typically seen in other elections. Figuring out how these less politically engaged voters will behave, and how many will cast a ballot, is an unusual challenge for both pollsters and the campaigns and campaigners themselves.
One thing we know for certain is that opinion is closely divided. We should therefore exercise even more caution when digesting the latest shift in the polls from Yes to No or No to Yes. Everyone engaged with this passionate debate will be keen to read their own preferences into every tremor of public opinion, which means now more than ever we must keep in mind than many of the small moves in coming days will be nothing more than the random fluctuations in patterns of response that are an inherent part of opinion polling. When the result is tight enough to be within the margin of error, polls showing Yes at 49% and 51% amount to the same thing.
In the words of one recently retired Scottish football manager (who has declared himself firmly in the No camp), it’s “squeaky bum time”.

