
With exactly a year to go until the country goes to the polls, the Polling Observatory team launch their forecast for the outcome of 2015 general election.
Starting this month, the Polling Observatory team is joined by a new member: our old friend and colleague, Christopher Wlezien of the University of Texas at Austin, who will be helping us to produce a long term forecast for the 2015 General Election, using methods we first applied ahead of the 2010 election.
Our method involves trying to make the best use of past polling evidence as a guide to forecast the likeliest support levels for each party in next May’s election, based on current polling, and then using these support levels to estimate the parties’ chances of winning each seat in the Parliament. In this first post, we introduce the poll-based element of this model; in later posts we will introduce and explain the seat-based element.
The past is, of course, an imperfect guide, as voters and parties change and each election is, to some extent, unique. However, this does not mean past polling tells us nothing.
On the contrary, as we have shown in previous research, careful analysis of past polling reveals common underlying trends and patterns in British public opinion. It is these trends and patterns which we use to estimate our forecast of the likely path of public opinion.
In 2010, our method fared relatively well against the alternatives on offer, getting the overall outcome of a hung Parliament with the Conservatives as the largest party correct, and coming quite close on all three parties’ seat totals. The forecast performed well relative to others forecasting models published by colleagues, notably beating celebrated polling oracle Nate Silver’s prediction for the British election.
The method works in the following way. Thanks to the Fixed Term Parliaments Act, we know how many days remain until the next general election. For any given day, we can use all the polling data from past general election campaigns to estimate two things: how closely the current polling is likely to reflect the election outcome, and which direction public opinion is likely to move in between now and election day. We do this for each of the three main parties separately, seeing what polling history can tell us about their respective fates.
This is one of the simplest possible ways of forecasting how elections will turn out, and it leaves out an awful lot. We do not look at the impact of leader approval ratings, the objective state of the economy, or public economic perceptions – things which other models have used as forecasting tools.
We simply take the best possible estimate of where public opinion is today (an estimate constructed using our poll aggregation method) and ask: How informative does history suggest this estimate will be as a prediction of the next election? Where does history suggest public opinion will move between now and election day?
Our method starts by considering the systematic and predictable ways in which the public’s intention to vote for parties varies over the election cycle – based on past evidence.
Some shifts in public opinion are impossible to anticipate, such as in reaction to shocks or events. Other dynamics may be more predictable, however; for instance that pre-election poll leads tend to fade or that parties may benefit from ‘campaign effects’ (such as due to increased attention during the official election campaign).
To forecast the election day vote share, we need to know the relationship between vote intention t days before the election and the vote share in past elections. Therefore, the first step in our forecasting procedure is to estimate the relationship between vote intention and vote share through a series of regressions – for each of the main parties – for each day of the election cycle.
To do this, we use all available polling data since 1945 (more than 3,000 polls) – across seventeen elections. This allows us to determine both how well the polls predict the final outcome on a given day (unsurprisingly the polls become more predictive, the closer we get to the election), and to determine whether support for a party is above or below its long-term equilibrium level – and is likely to gain or fade as the election approaches.
Our past work, using this very simple method, suggests it has some useful lessons to teach us.
Firstly, we find that the predictive power of polls evolves differently for different parties: polling of Conservative support becomes steadily more predictive from over a year out, while for Labour and the Liberal Democrats, the main improvement in accuracy comes in the last six months. Secondly, we find that support for Labour, the Liberal Democrats and the Conservatives tends to “regress to the mean” – if current support is above the long run average, it tends to fall; if it is below, then it tends to rise.
While the daily regressions teach us a lot, there is a fair bit of “noise” in the regression estimates, as each regression is based on 17 data points (elections). However, although each regression is based on only 17 data points, we have a separate regression for each day and we know that the estimates for one day should only differ so much from the estimates from the days immediately before and after it.
Therefore, the second step in our forecast procedure is to reduce the noise by smoothing the regression estimates over time. The procedure we use to produce the smoothed regression estimates is similar to the procedure a sound engineer would use to remove static from a sound recording.
The third step in our forecast is to use the smoothed regressions estimates to produce forecasts by plugging our daily estimates of vote intention into the smoothed regression equations. These vote intention estimates come from the same poll aggregation method we use in our monthly Polling Observatory updates – a Bayesian averaging of the polls.
In the final step, we pooled the forecasts over 30 day intervals, so that the new pooled forecast on each day is a Bayesian averaging of all forecasts up to 30 days prior to that day.
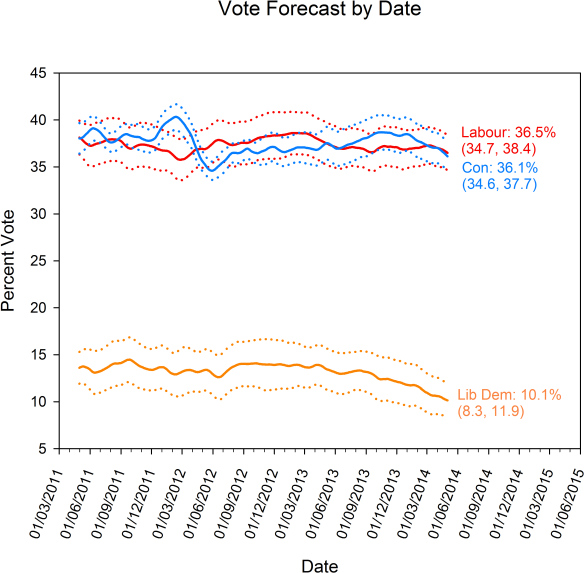
The predictions we get by applying these methods to current polling since March 2011 are shown in the figure below.
Our forecast model has consistently predicted a very close result – the Conservative vote share is expected to recover from its current level of around 32%, rising to around 36%, within half a percentage point of Labour, whose poll share is not expected to change much from current levels. In vote share, the result is close to a dead heat – the Conservatives are currently forecast to have 36.1%, and Labour 36.5%. The Liberal Democrats are forecast to recover some ground from their current polling position, but still put in their weakest performance in decades, with a forecast vote share of 10.1%.
But forecasting vote shares can only take us so far. Westminster elections are won and lost in 650 separate battles for constituencies up and down the country.
The aggregate vote shares are only an imperfect guide to the likely distribution of seats – our current forecast of a 0.4 point Labour lead in vote share, for example, would be likely to produce a large Labour lead in seats. In future posts, we will employ the second part of our forecasting model to translate these vote shares into seat shares.
The seat-based section of the forecast also provides us with a mechanism to examine two of the big unknowns in our forecast – how the Liberal Democrats will perform after their first term in government for generations, and the impact of UKIP. Neither has any historical precedent, so we cannot model these effects in the historical part of the model.
However, we can take an alternative approach, taking the baseline predictions from our historical model and applying different scenarios in the seat based part of the model. This will give us some sense of how sensitive the likely outcome is to changes in the fortunes of the two smaller parties. We will explore such scenarios in future posts.
[…] out of Downing Street. A third model, issued by the respected political science bloggers at The Polling Observatory, has just been published today, and their rather different methods point to a very close finish in […]